← Index fig. 6
Smoke Aware
real-time wildfire smoke from 200+ ground sensors and satellites, with a retrieval-augmented analyst
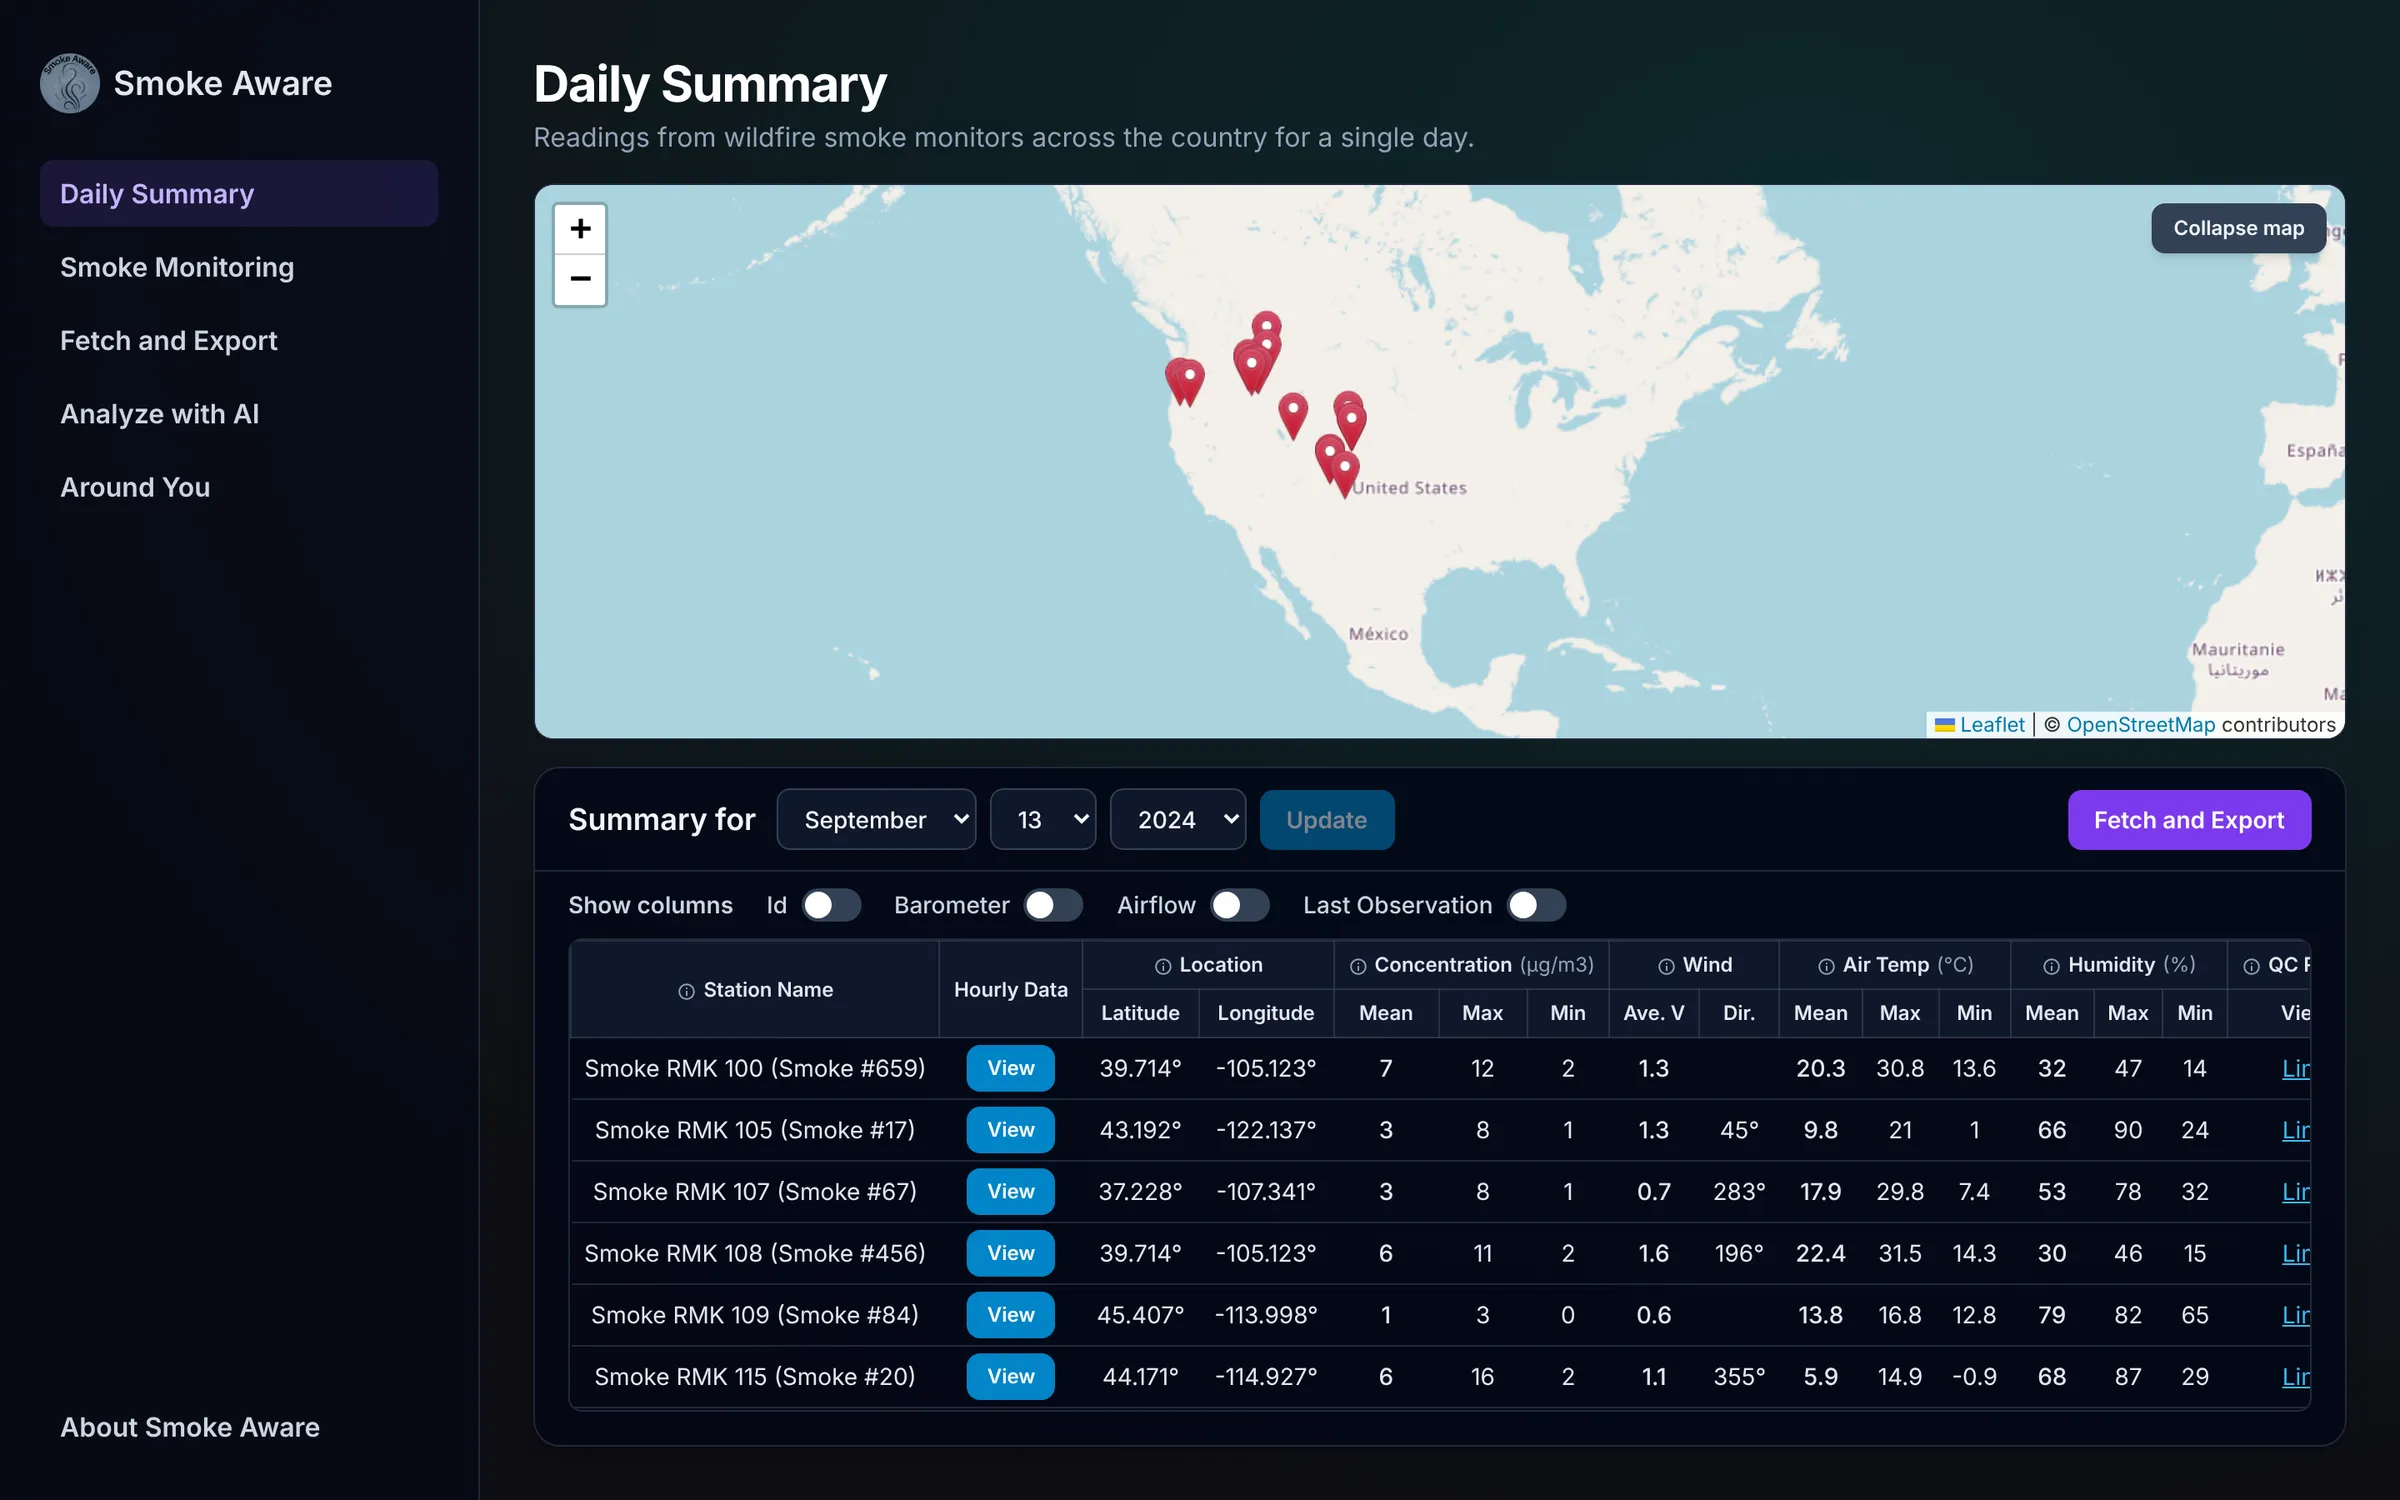
Wildfire smoke data is public, but it’s scattered. The temporary smoke monitors that get dropped near fires report to the Western Regional Climate Center, and their site shows you one station and one day at a time. If you want to know what the air looked like across the West on a given day, you’re opening a lot of tabs.
Smoke Aware puts it in one place: a map of every monitor, a daily summary, hourly charts for any station, an export button, and an assistant you can ask about the data.
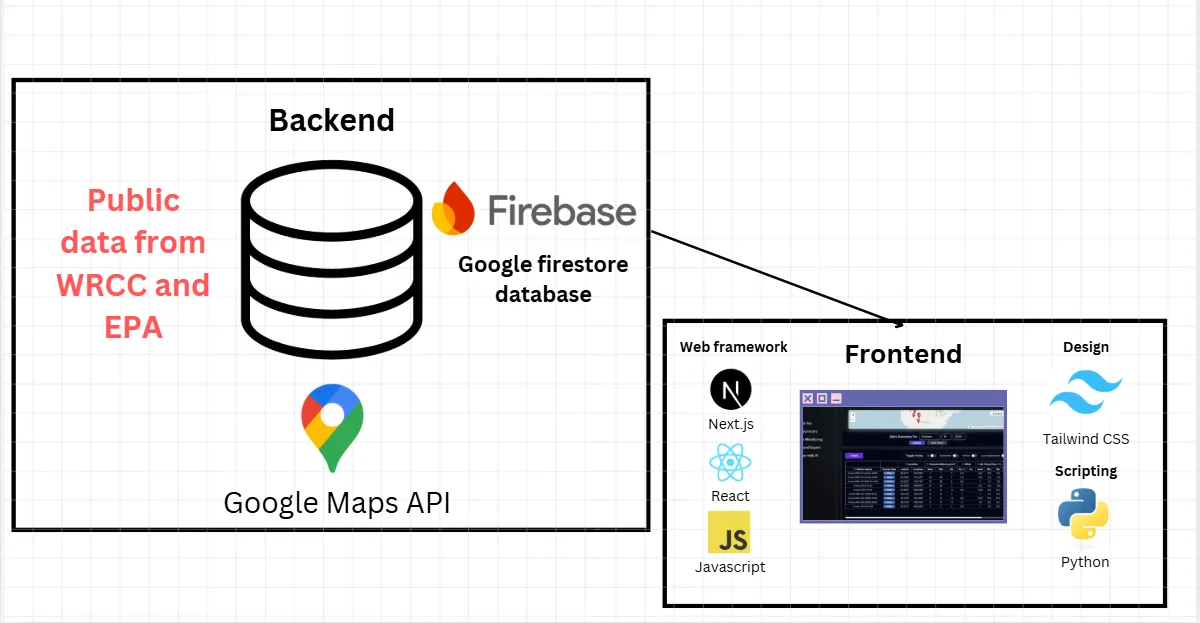
TLDR: a Next.js app that pulls readings from 200+ ground sensors, caches them in Firestore, and shows them on a map with daily and hourly views. Air quality for your ZIP code comes from Google’s Air Quality API. Exported data can be handed to a retrieval-augmented assistant that answers questions from the files. It’s been used internally at Emory, and it took second place in the Congressional App Challenge.
Getting the data
There’s no WRCC API in the friendly sense. Each station has a data endpoint that returns a page you have to pick apart. So the first real piece of code was a scraper: build the URL for a station and date, fetch it, cut the readings out of the response.
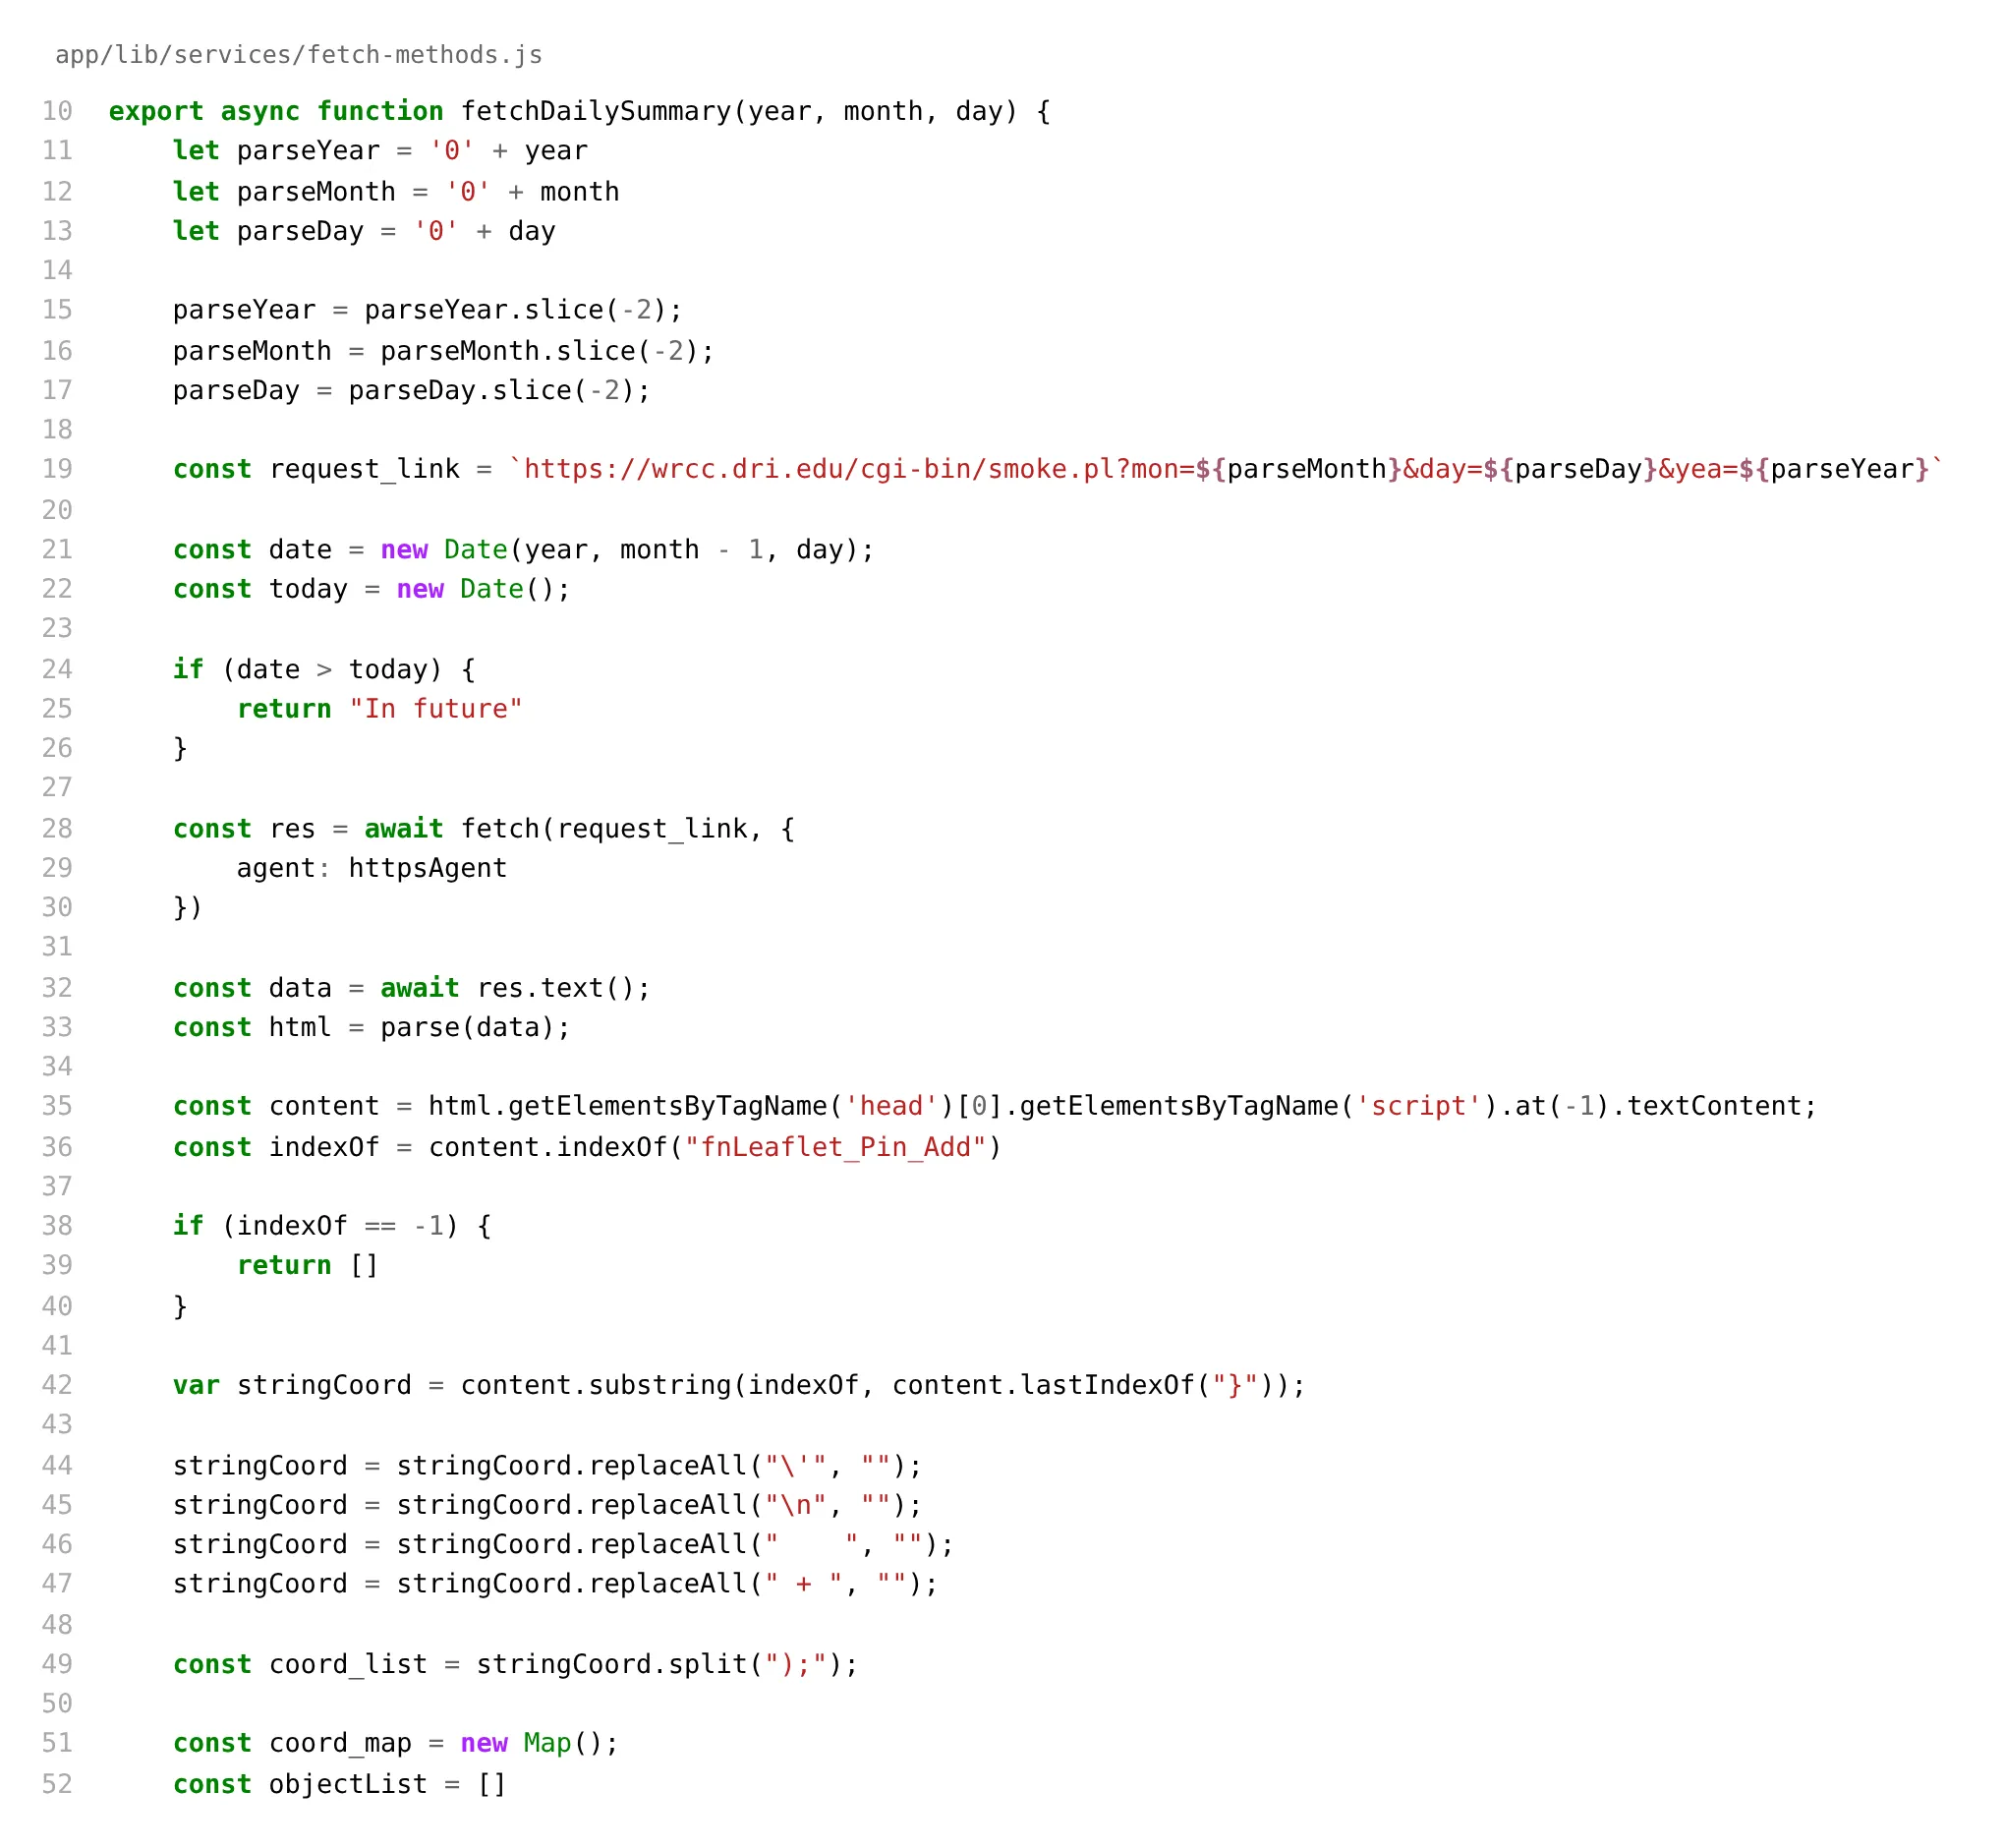
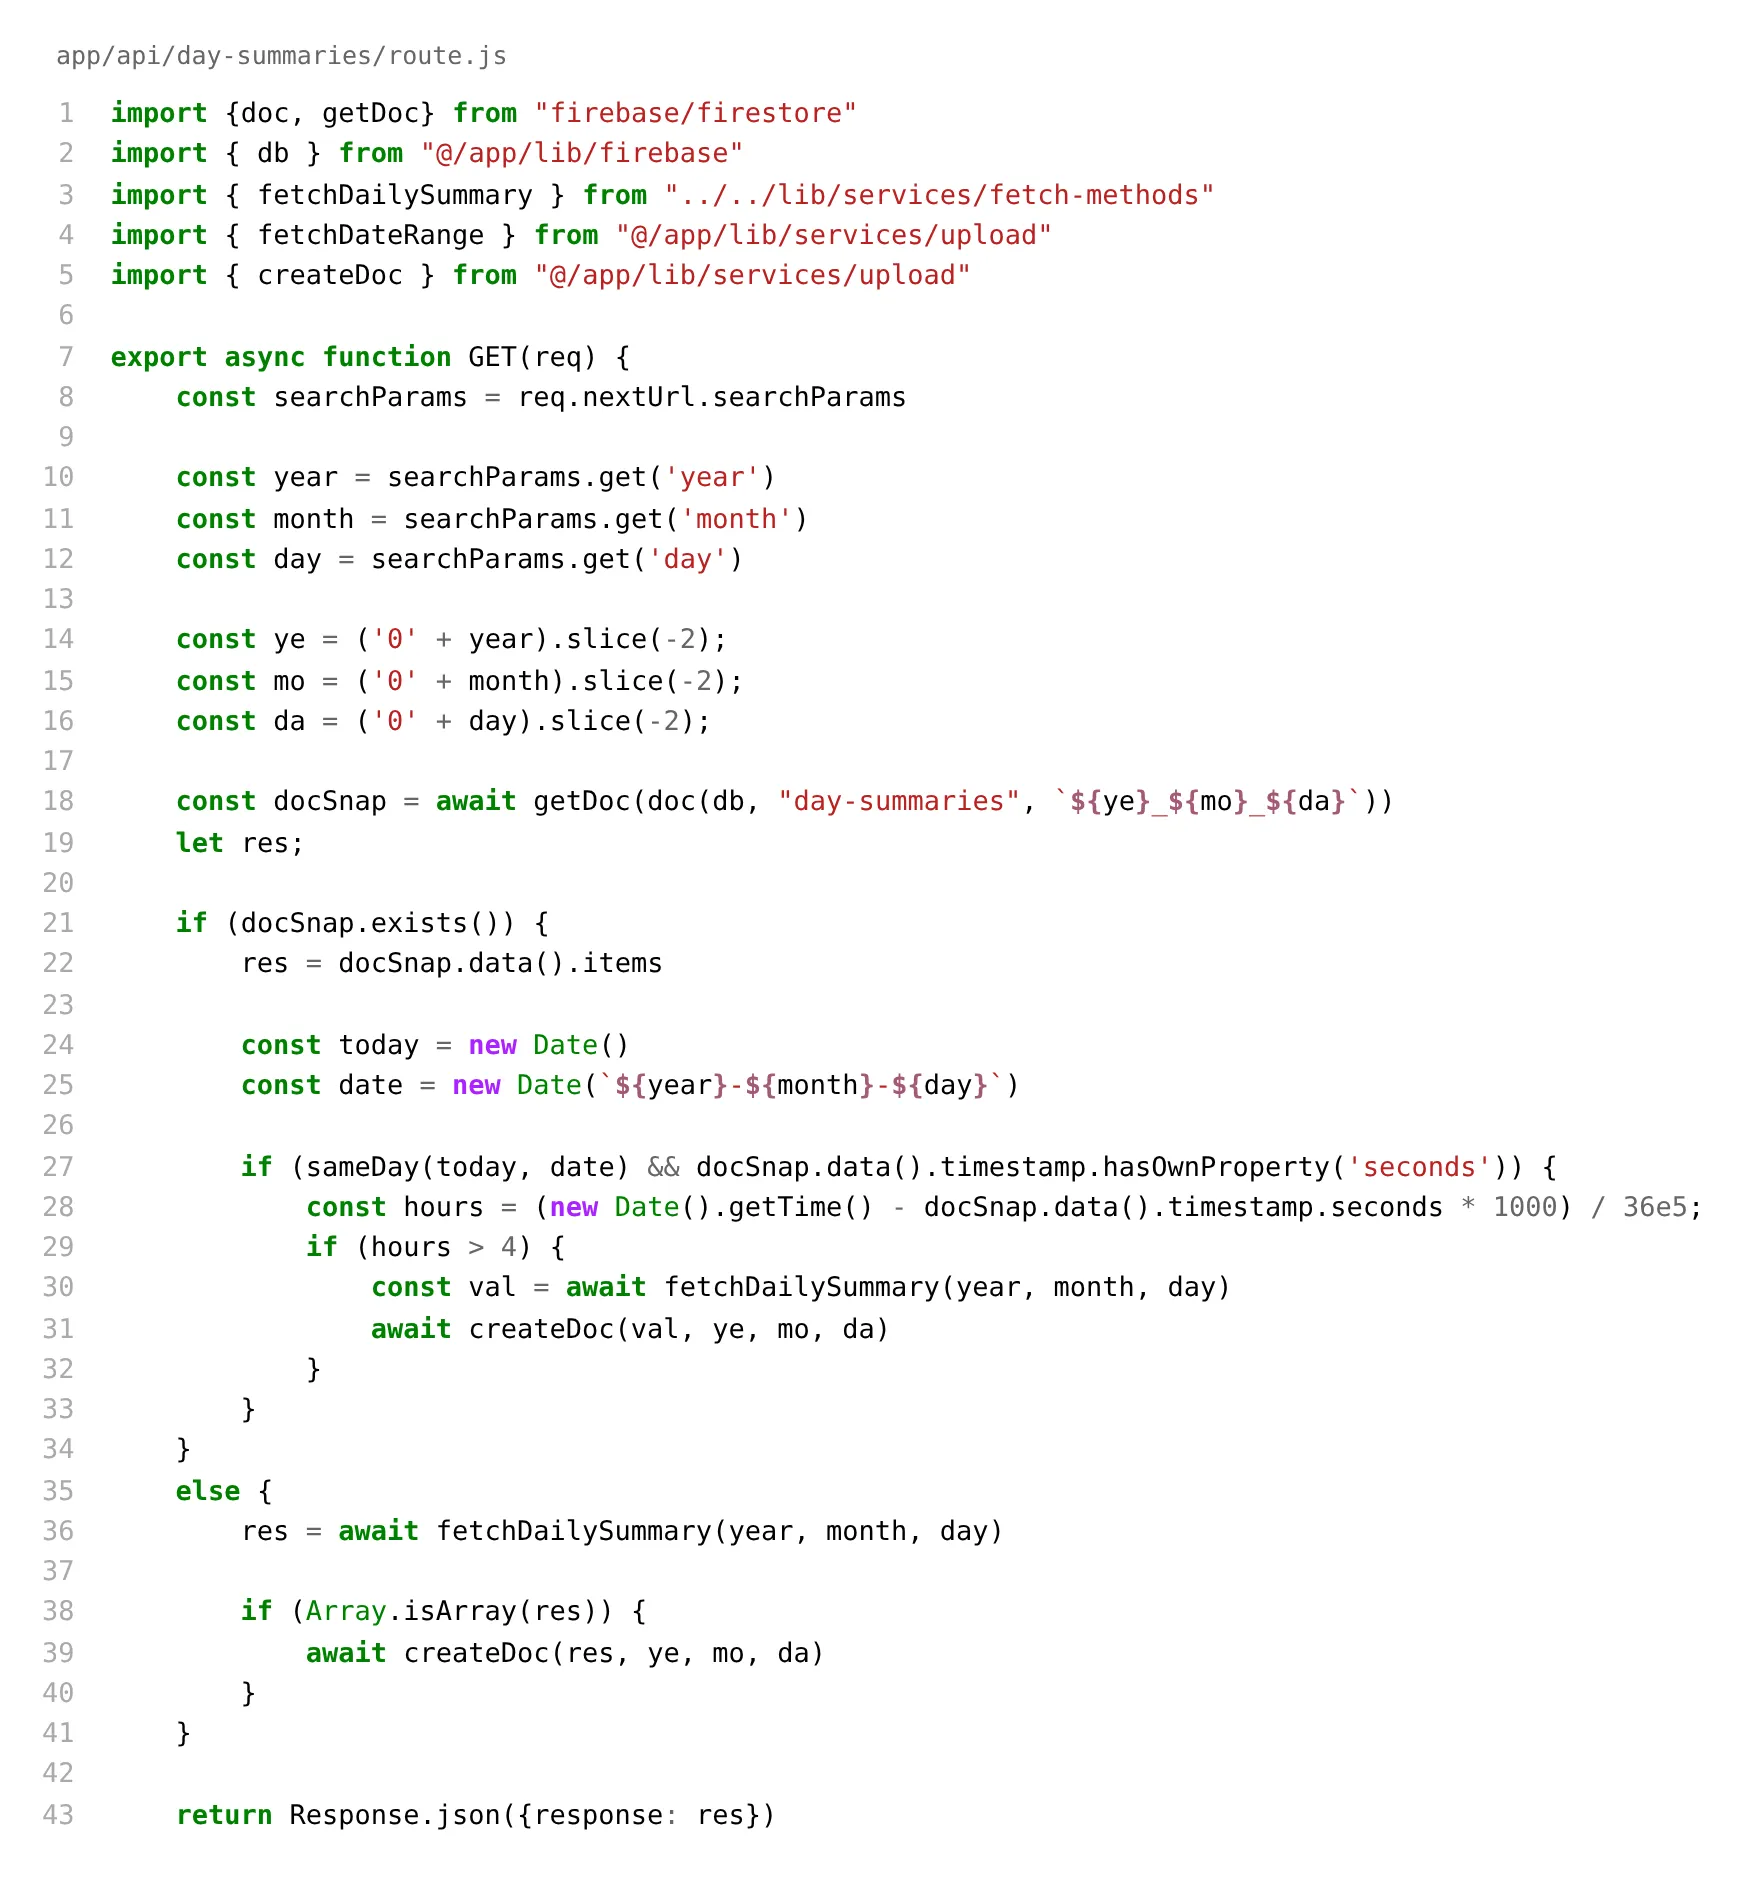
Scraping on every page load is slow and rude, so daily summaries go into Firestore the first time anyone asks for a day. Past days are served straight from there. Today’s summary gets refreshed every four hours.
Early on I also wrote a Python script to convert the raw files between formats: text, JSON, CSV, even PDF. The PDF route was a mistake (one row, “Unnamed” headers, columns falling off the page). CSV won, and it’s still what the export produces.
Before and after
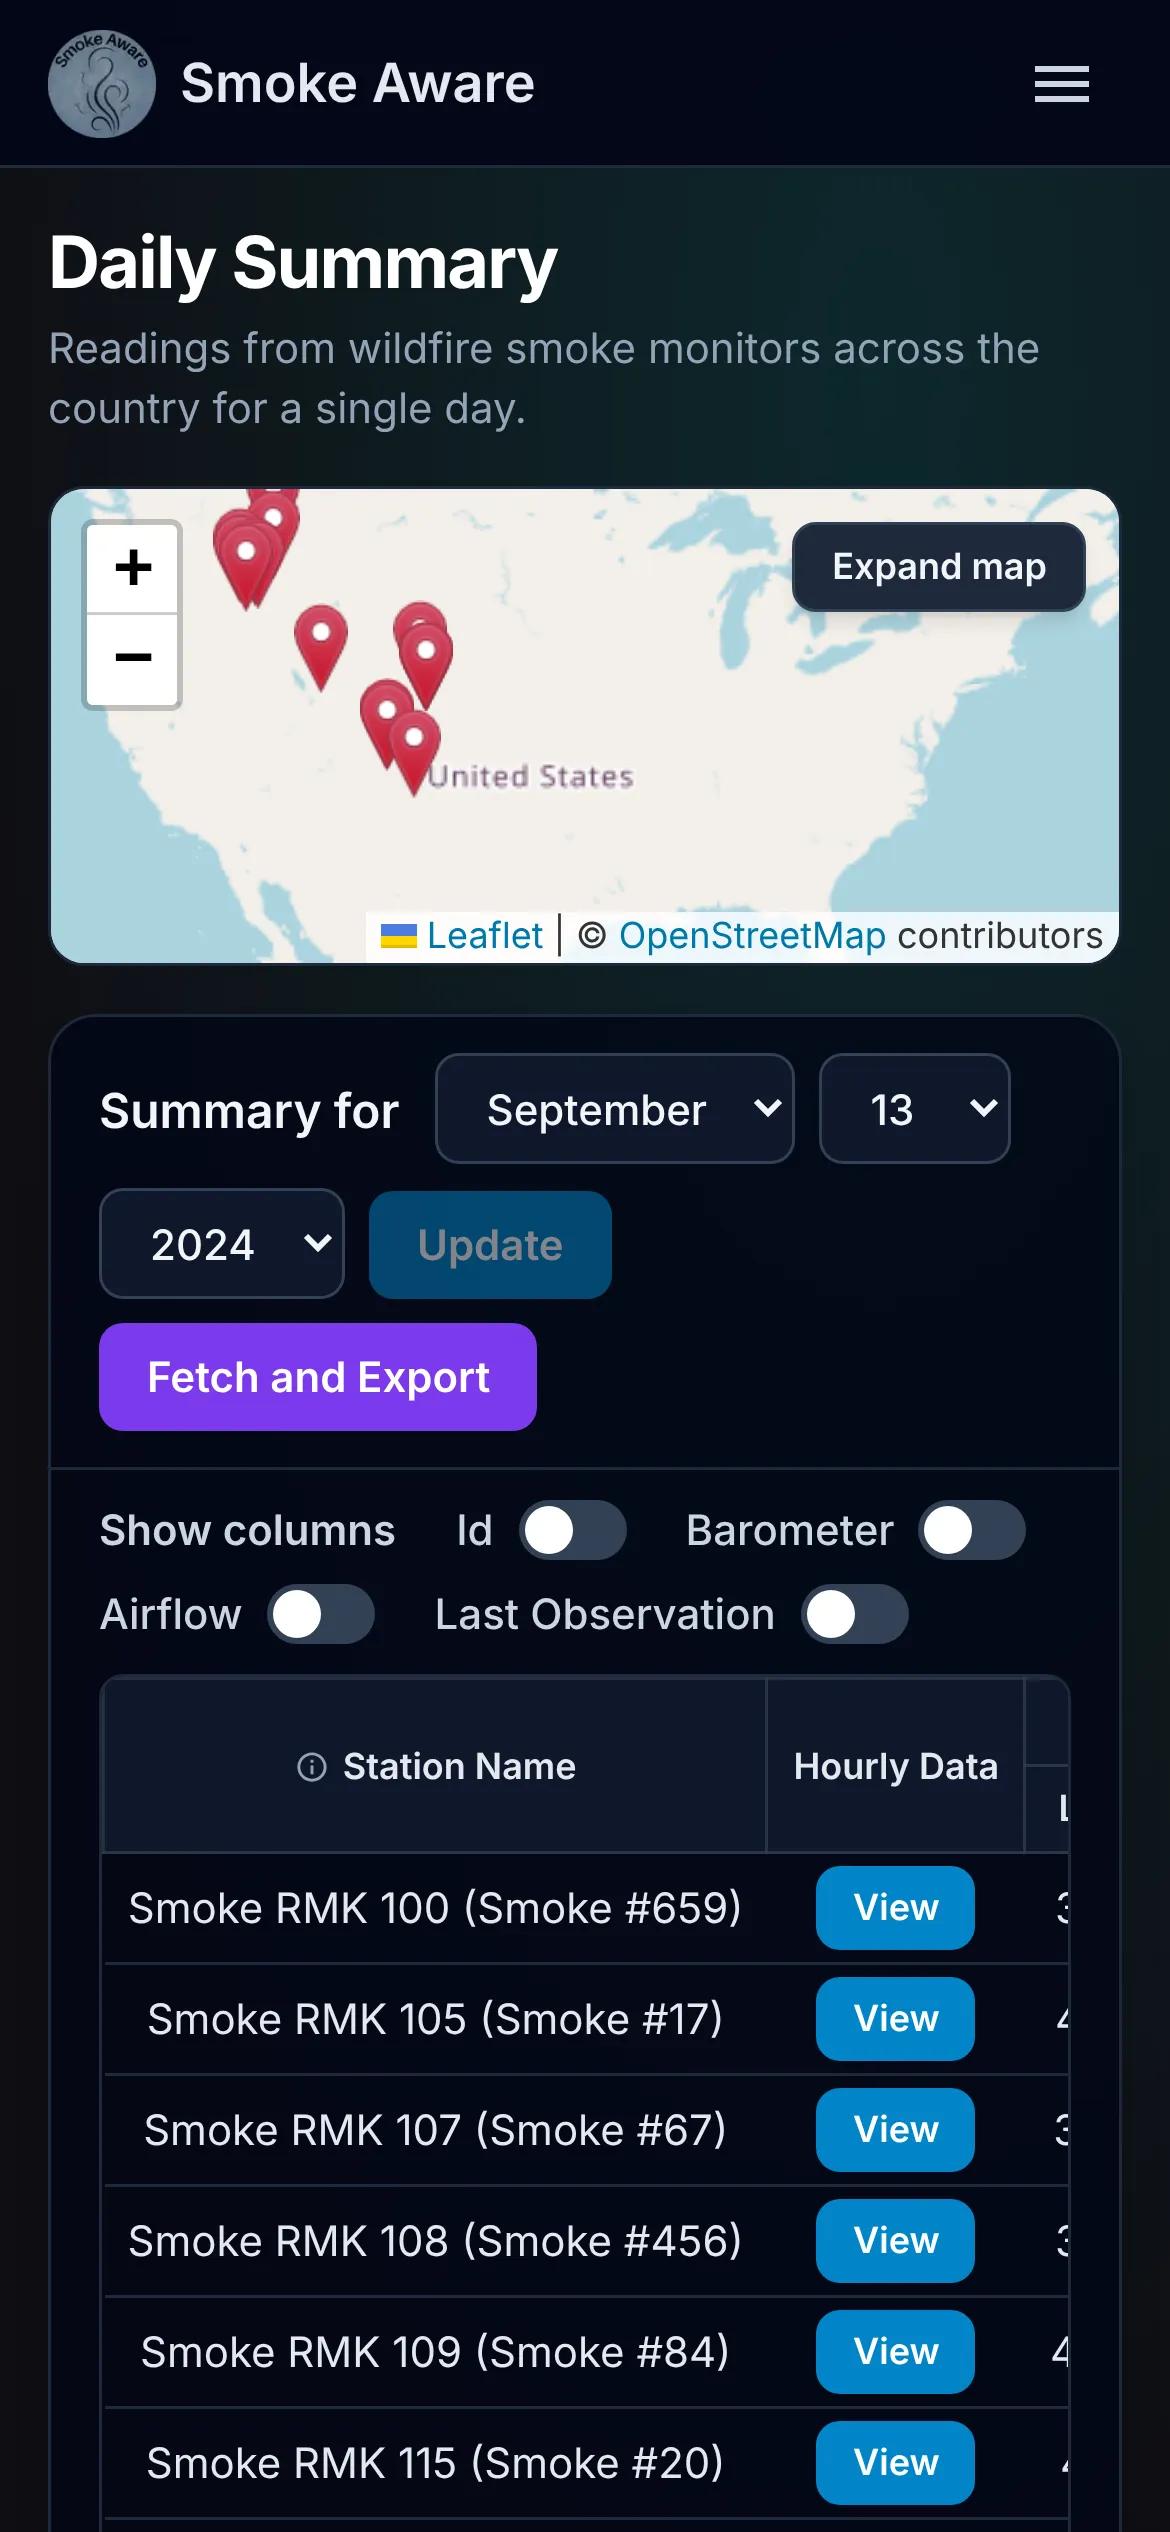
The app first went live in October 2024. This is how it looked in January 2026: everything worked, but each page was a form, a map and a chart stacked on top of each other.
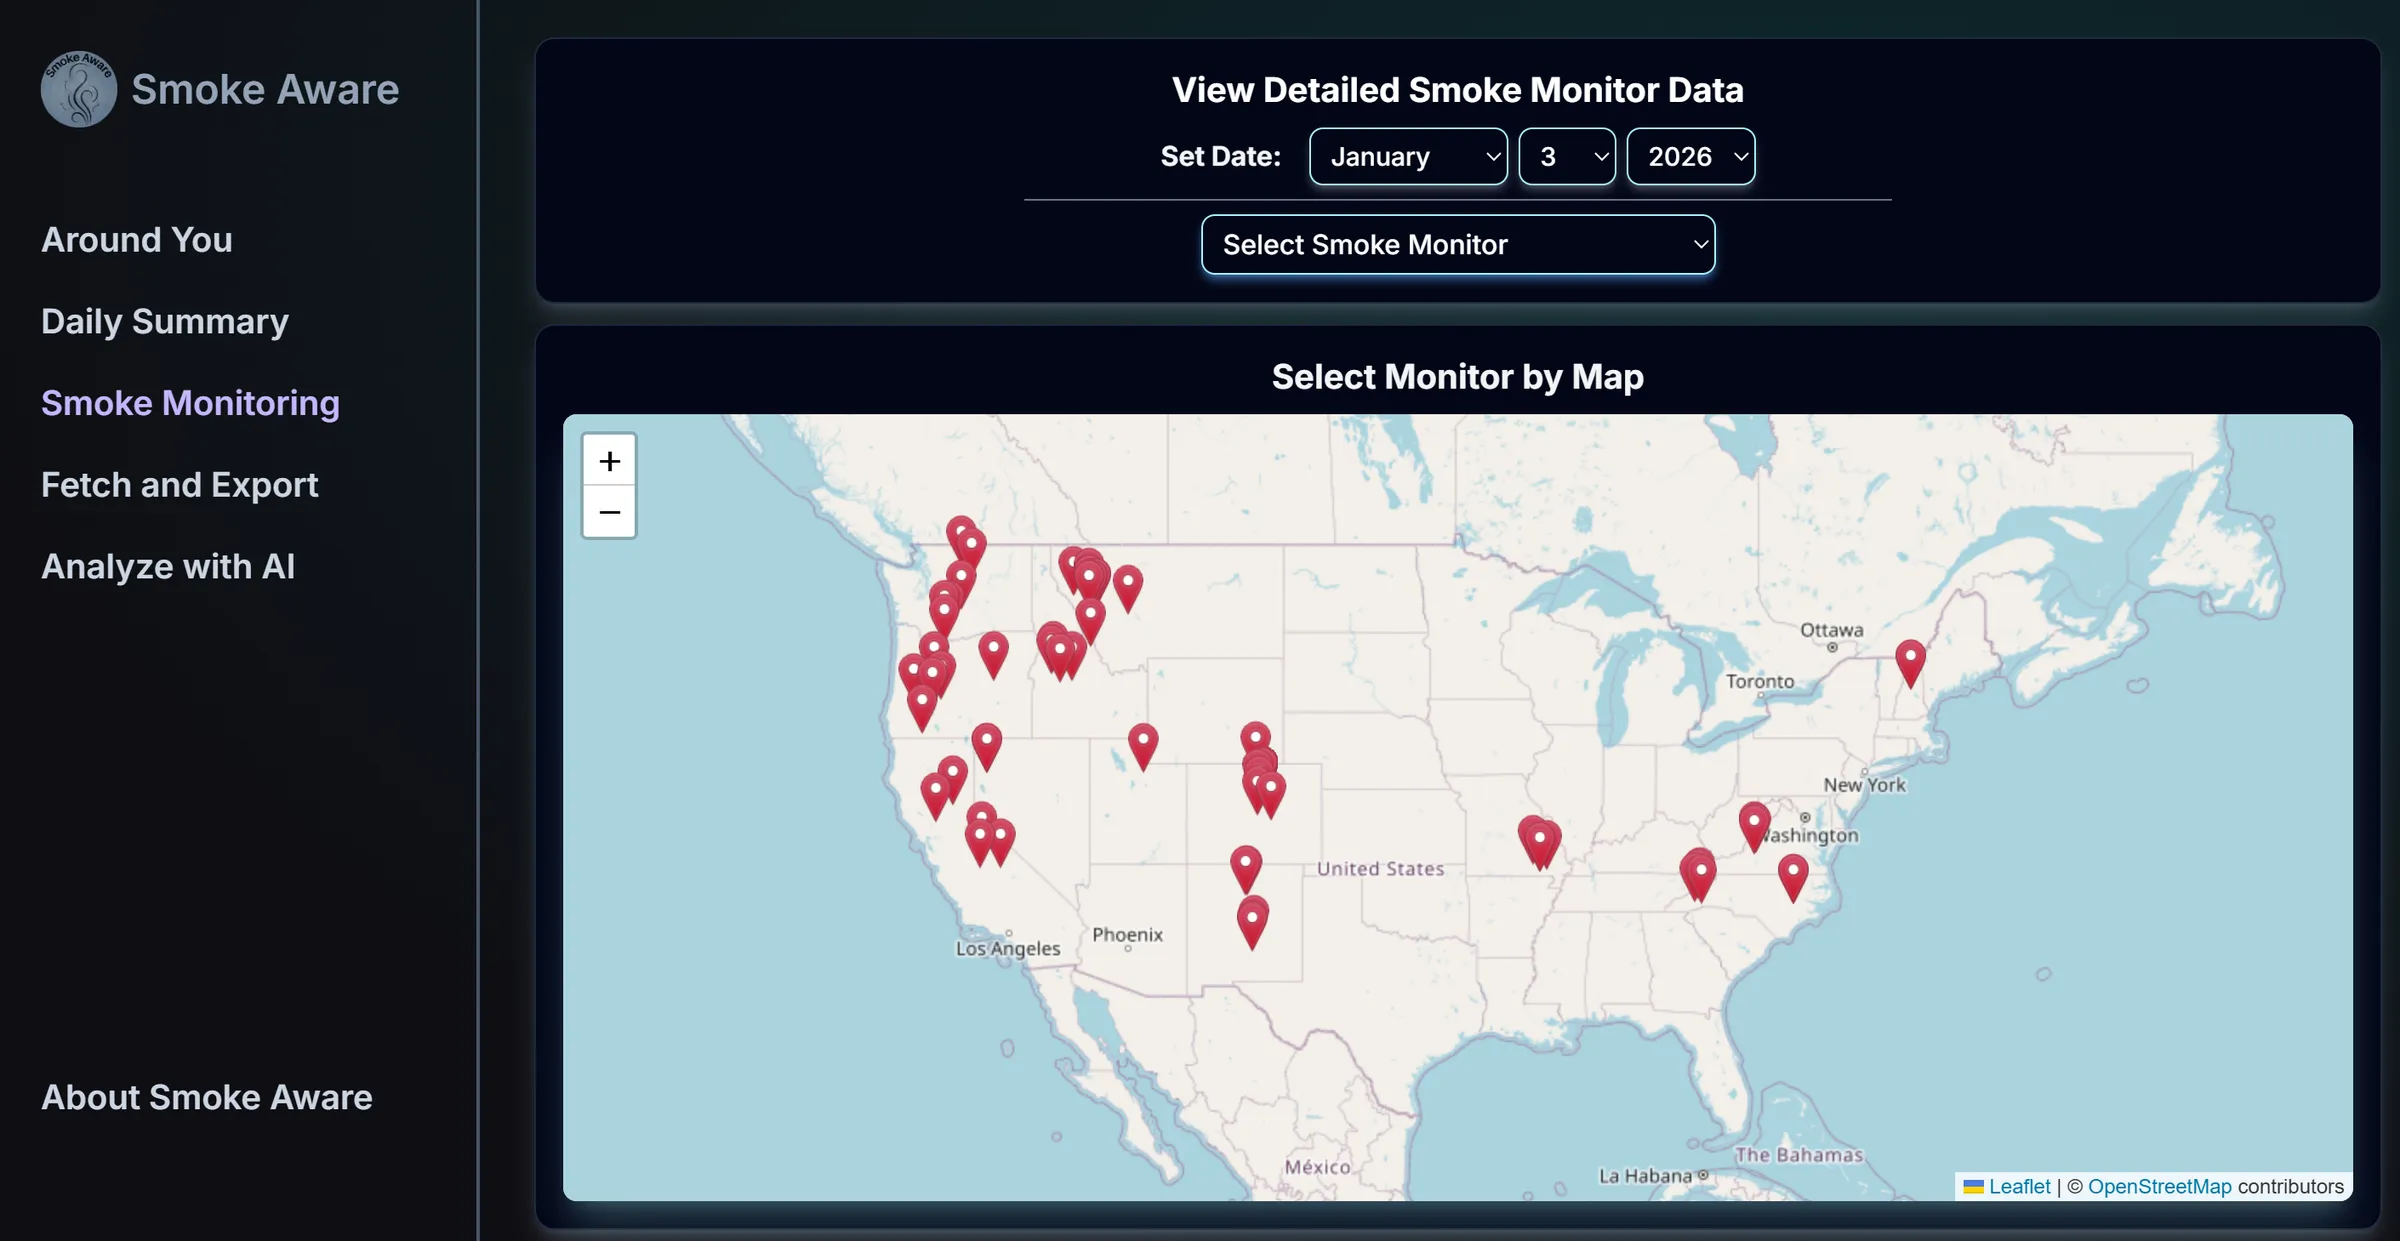
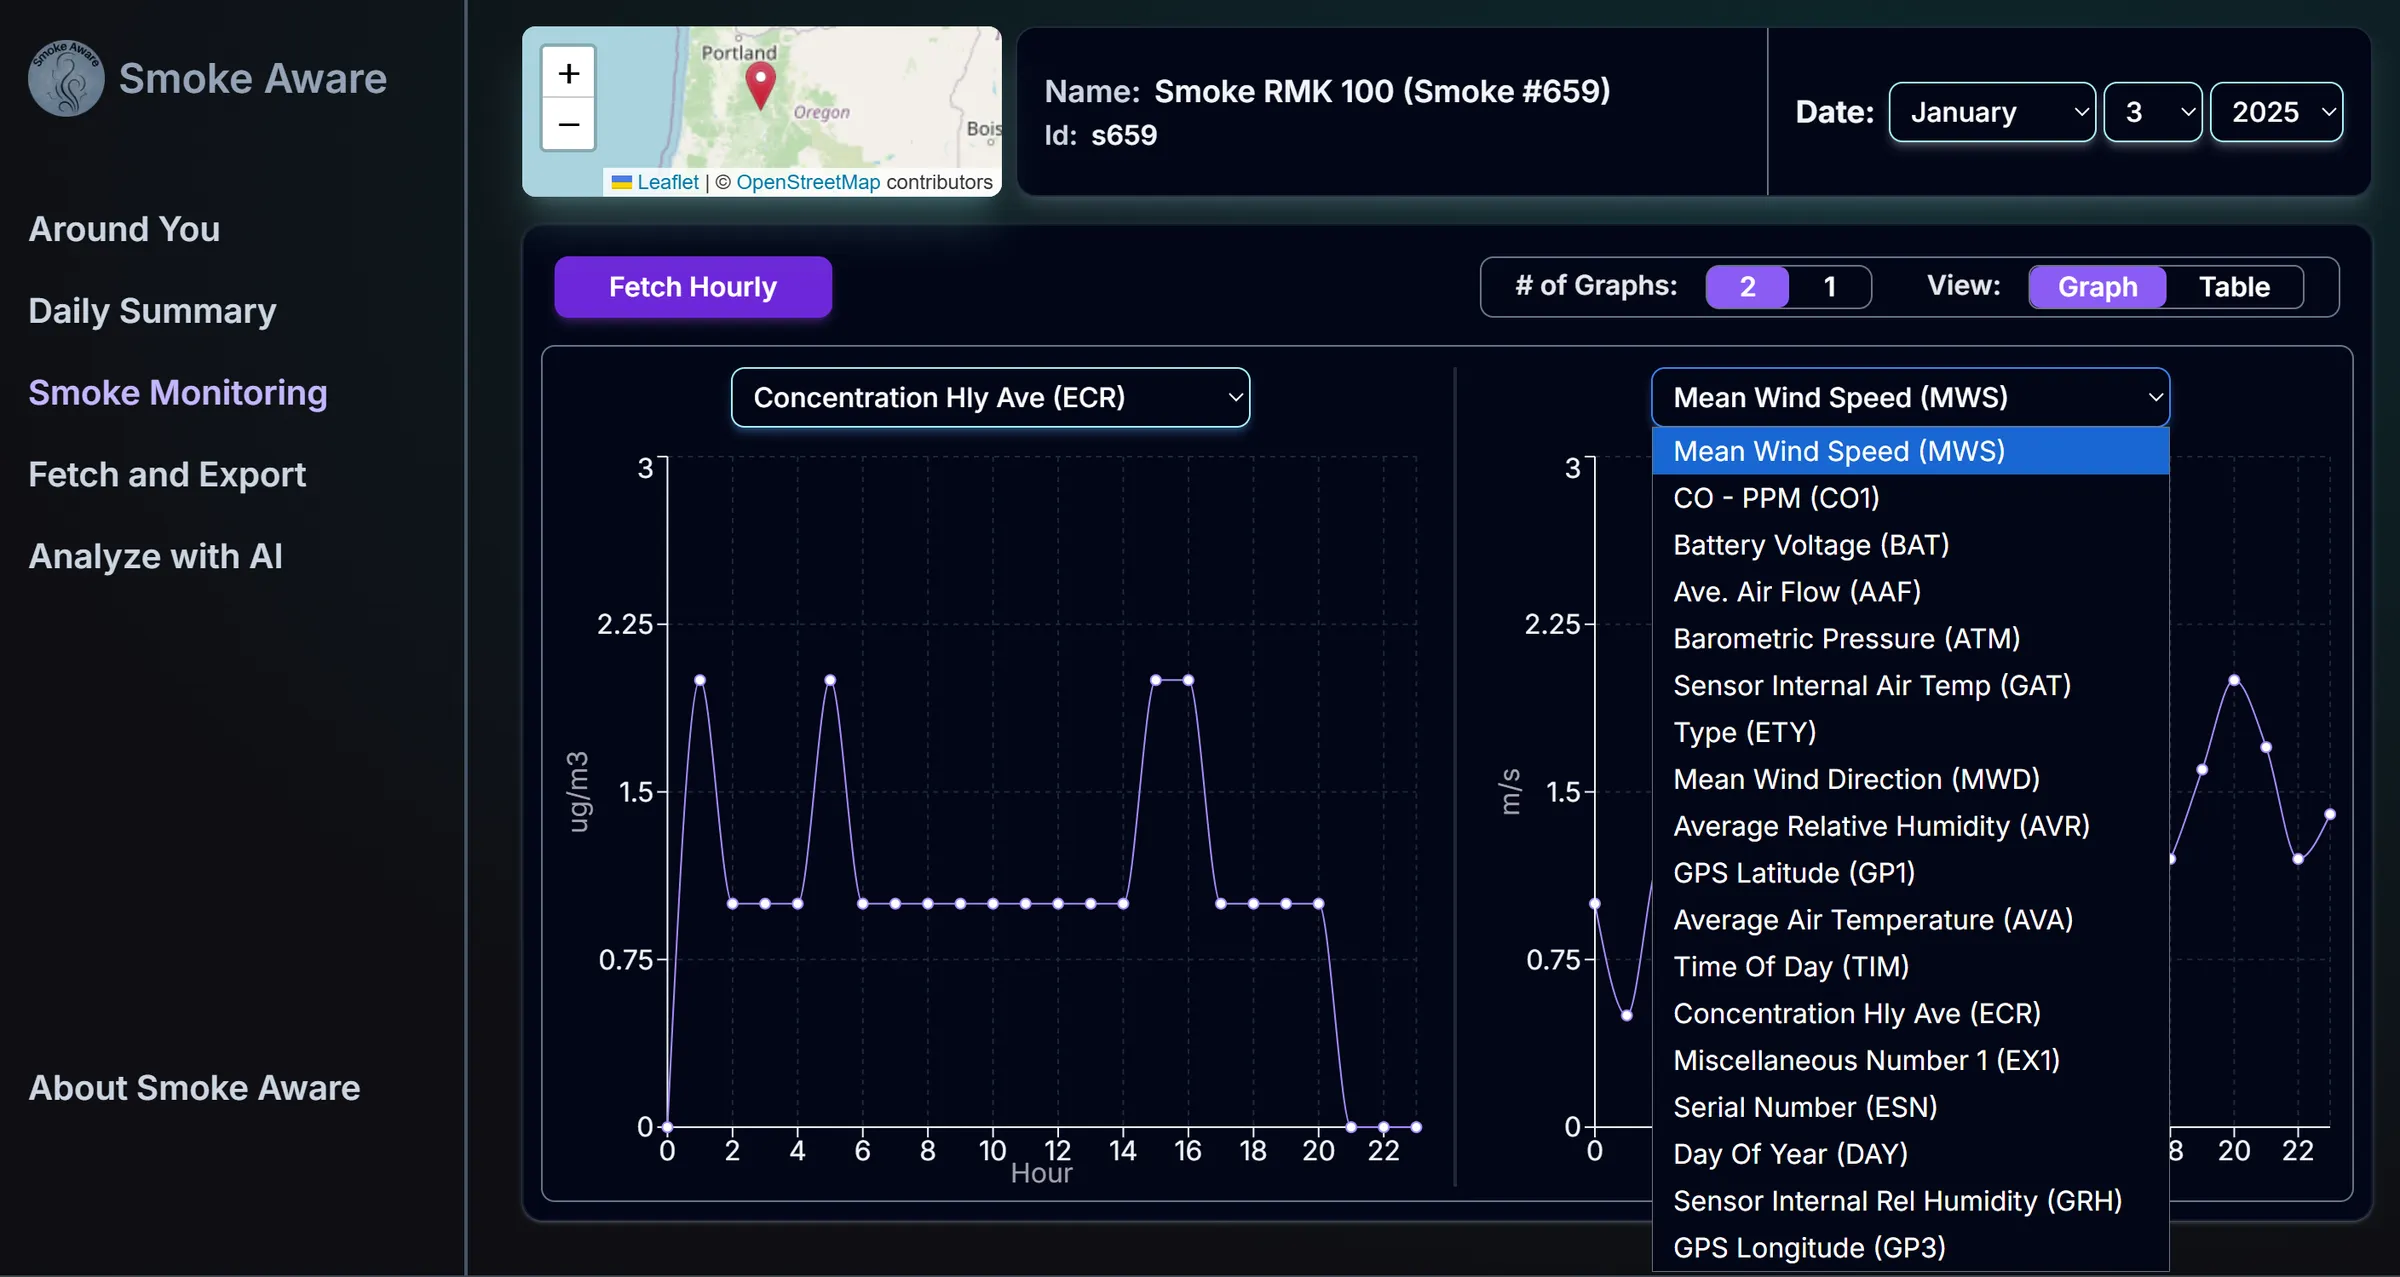
In September 2026 I redid the interface: a proper sidebar, the map and table sharing one screen, cleaner charts with tooltips. The data underneath didn’t change.
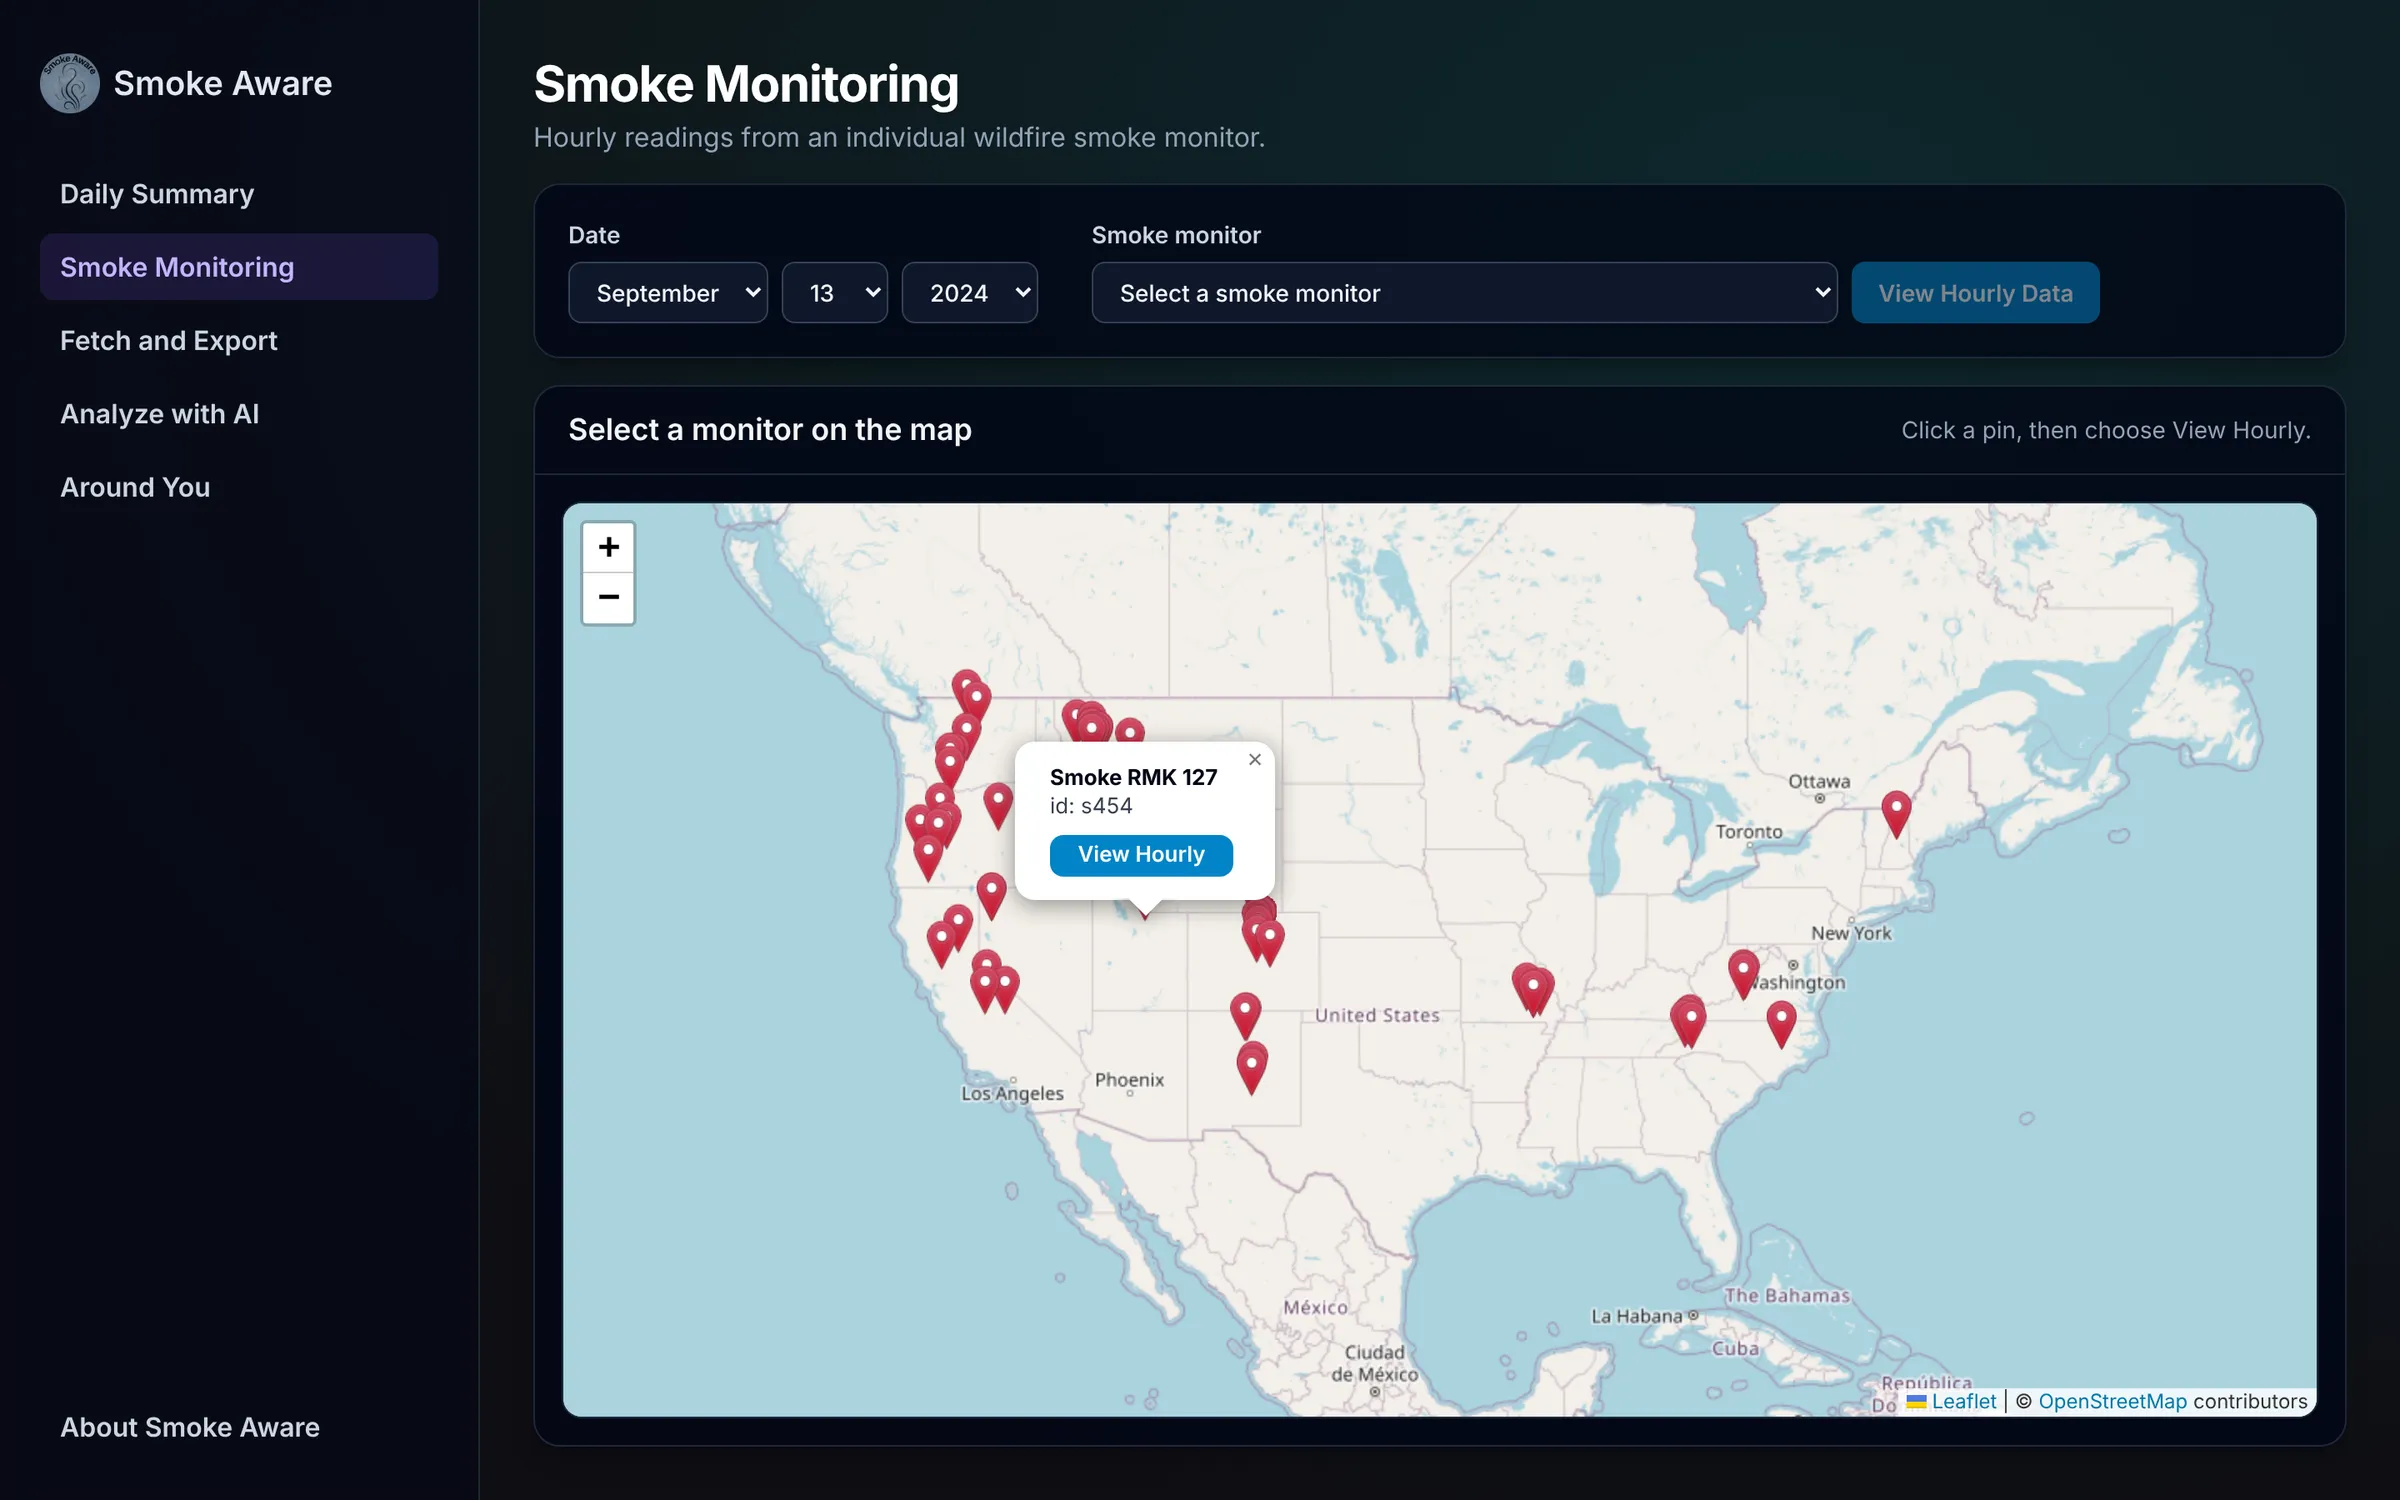
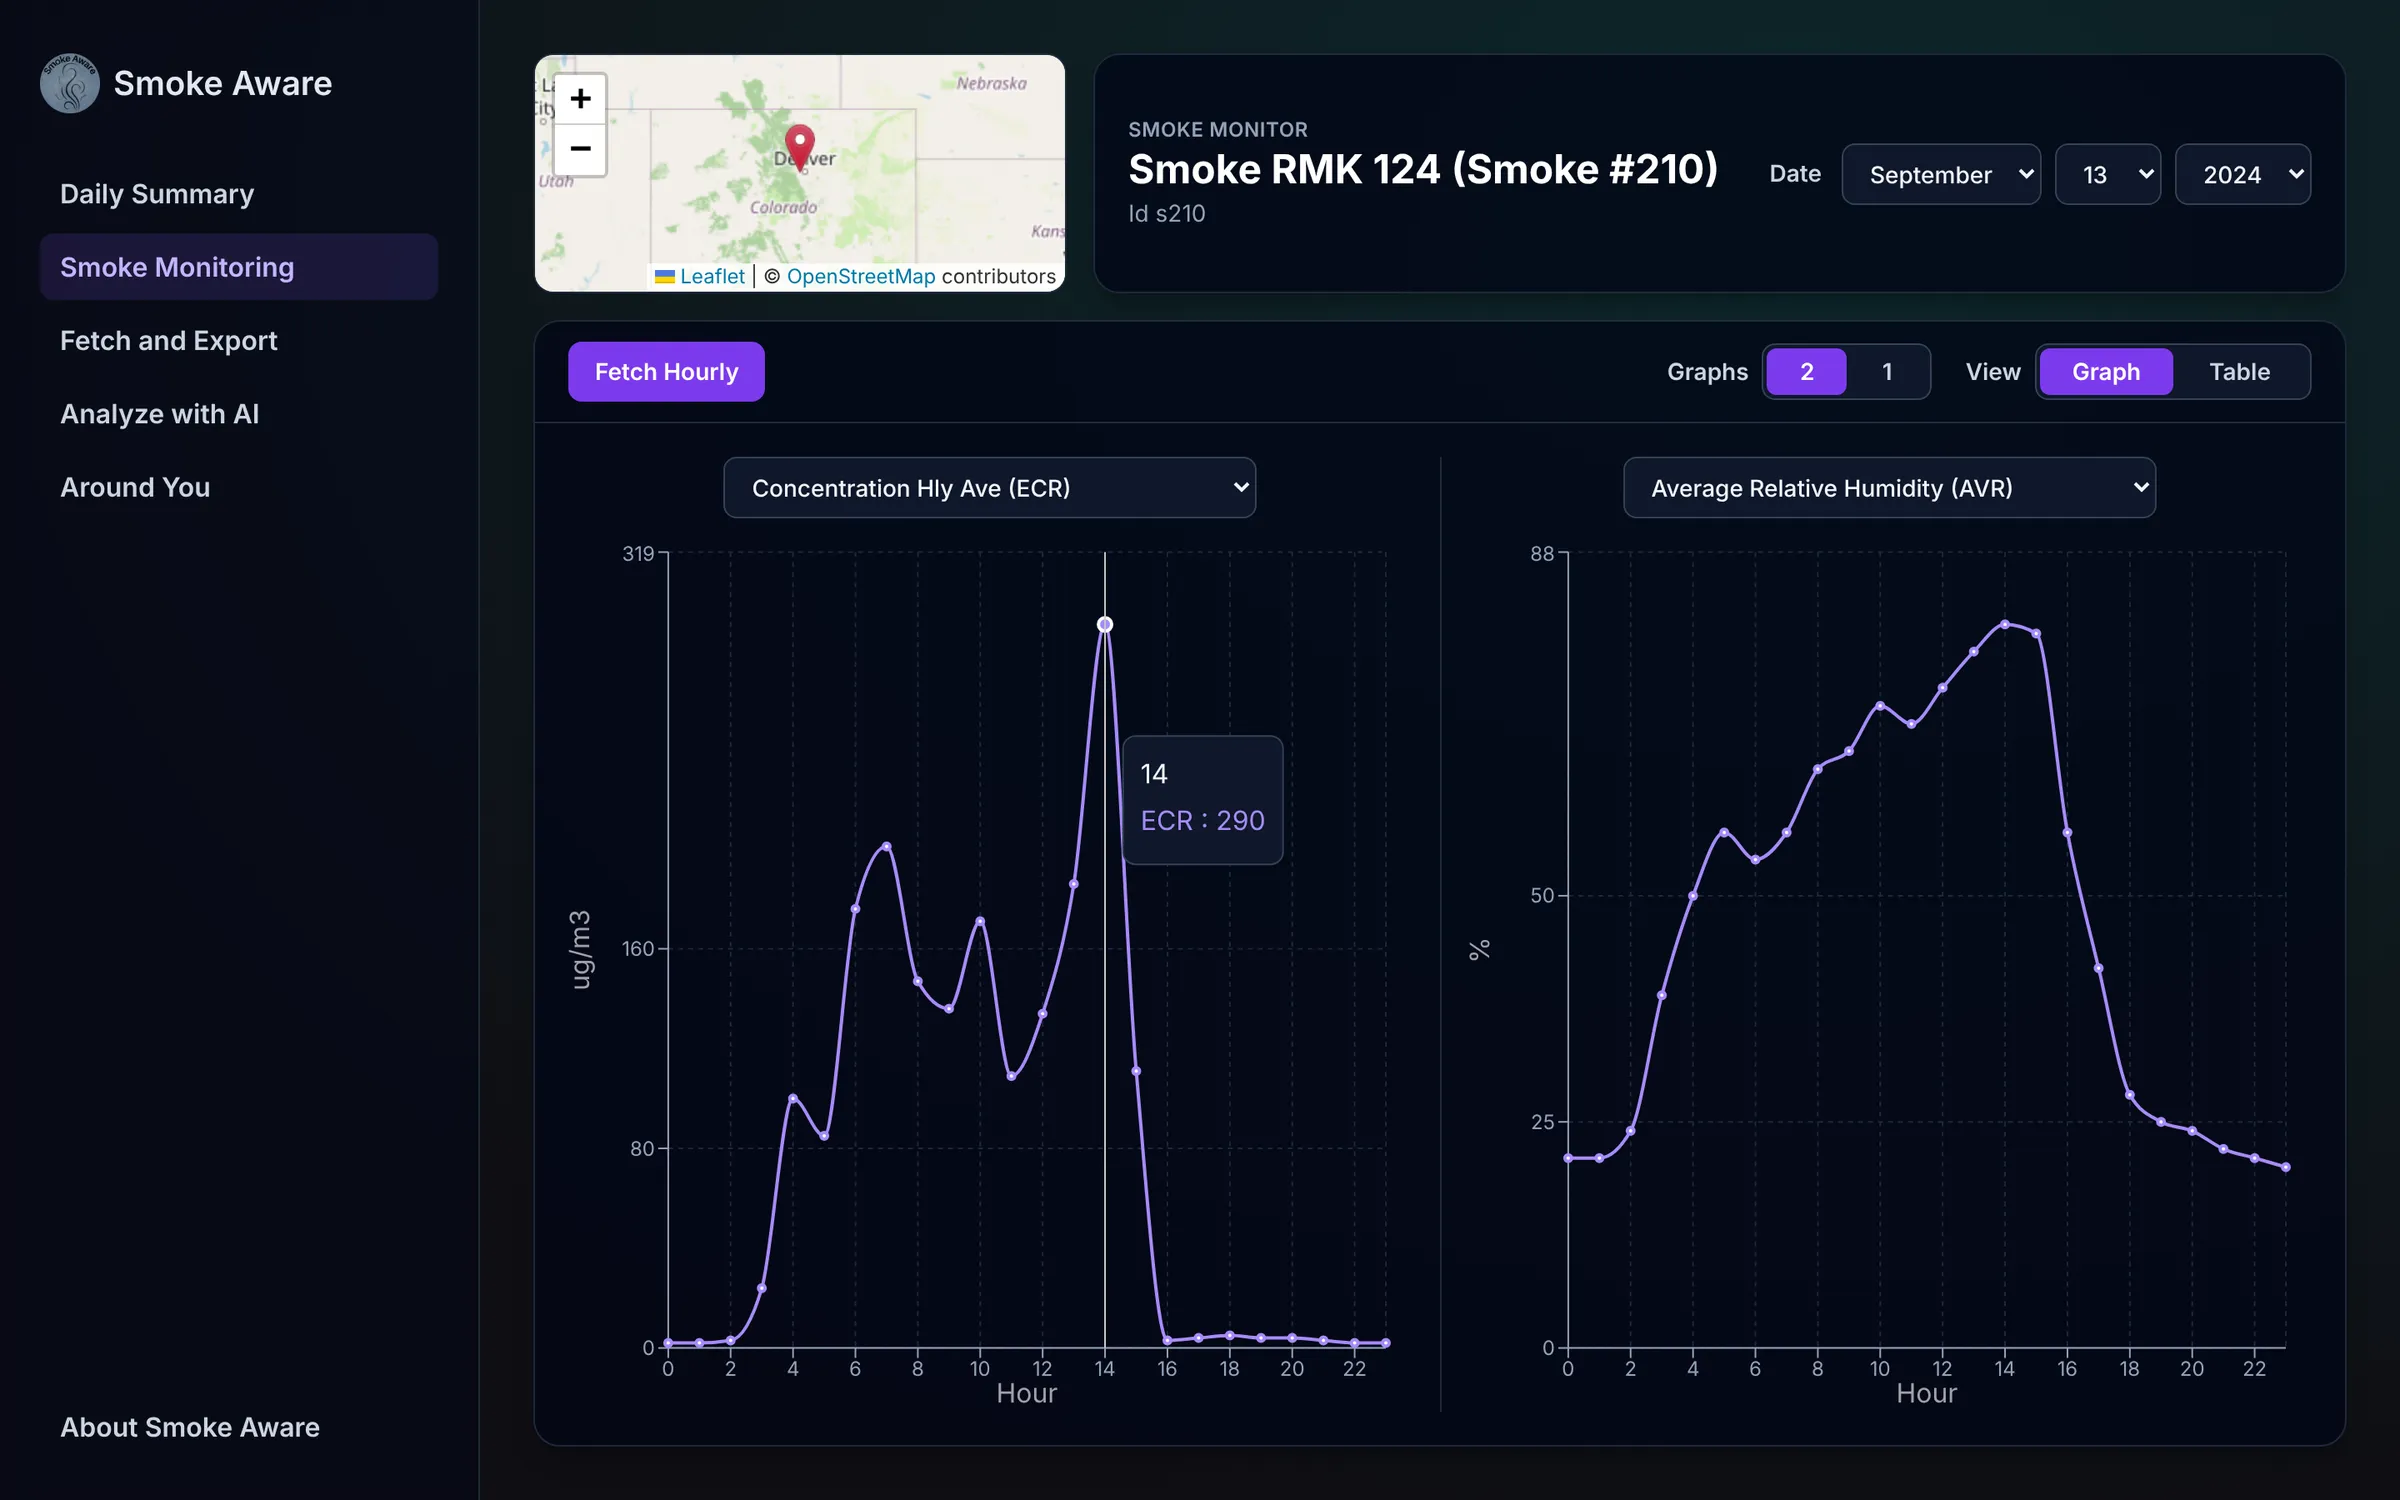
It works on phones too, with the sidebar folding into a drawer.
Around You
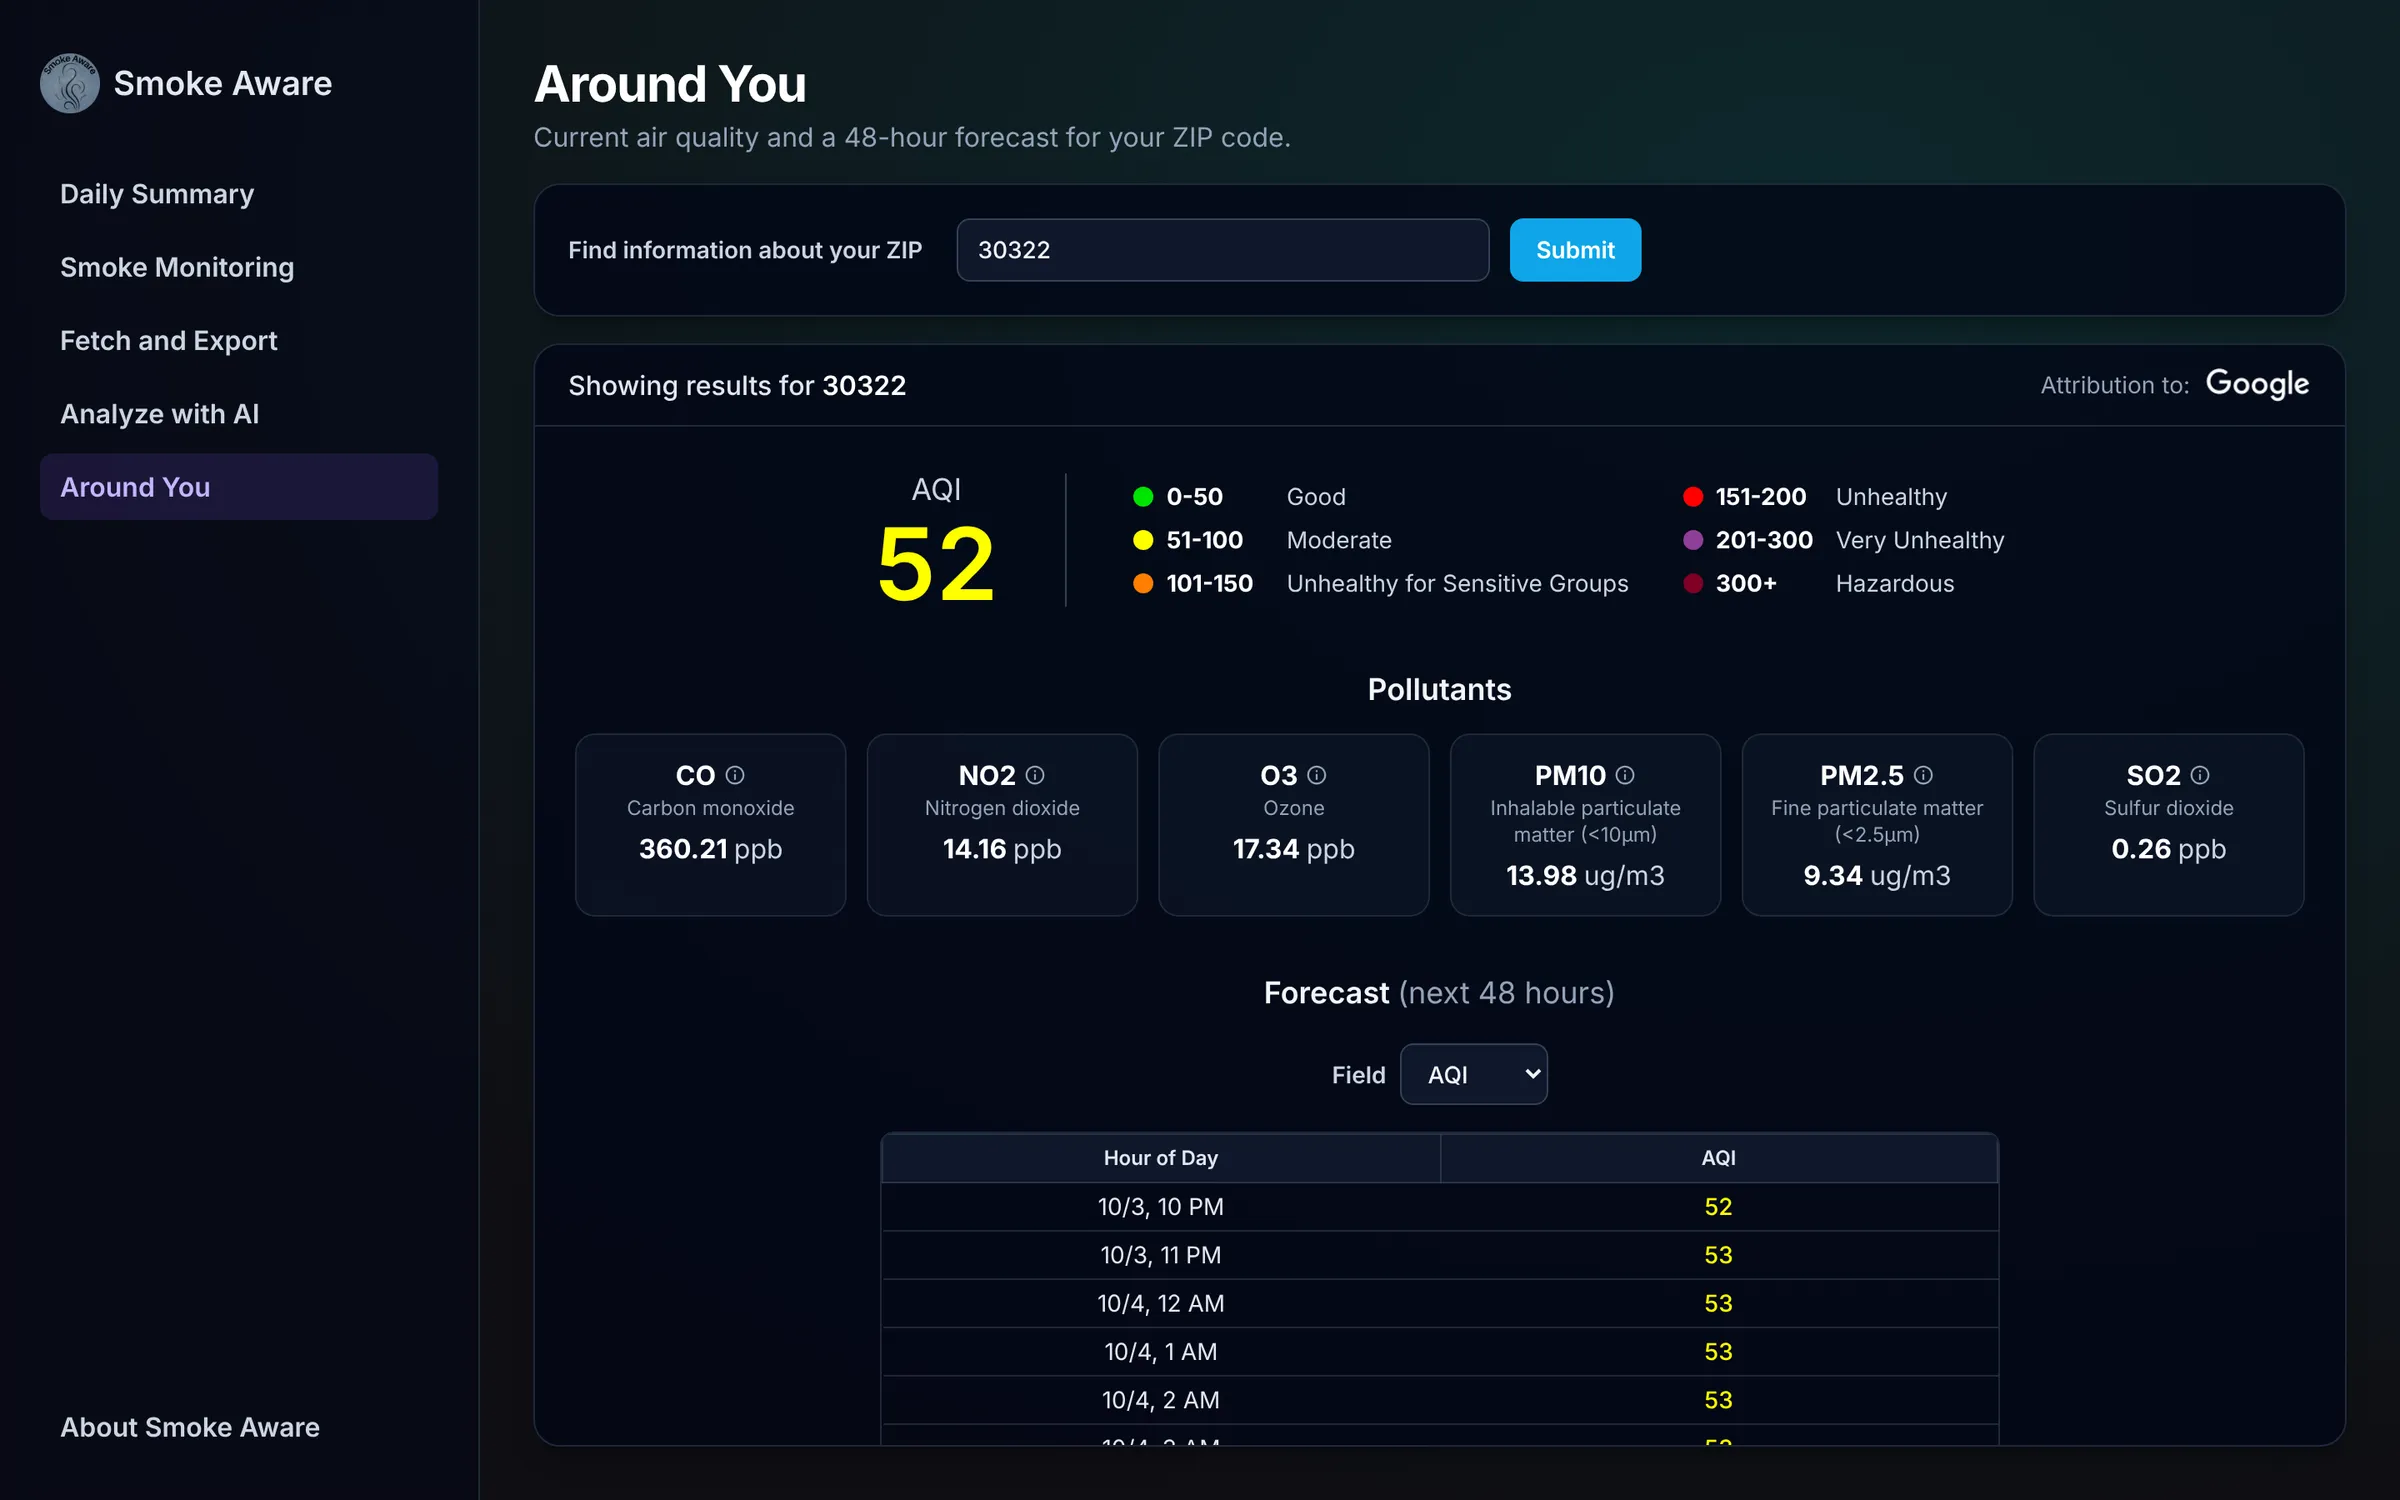
Not everyone wants a monitor network. Some people just want to know if they should go for a run. The Around You page takes a ZIP code and shows current AQI, pollutant levels and a 48-hour forecast from Google’s Air Quality API.
Export and the assistant
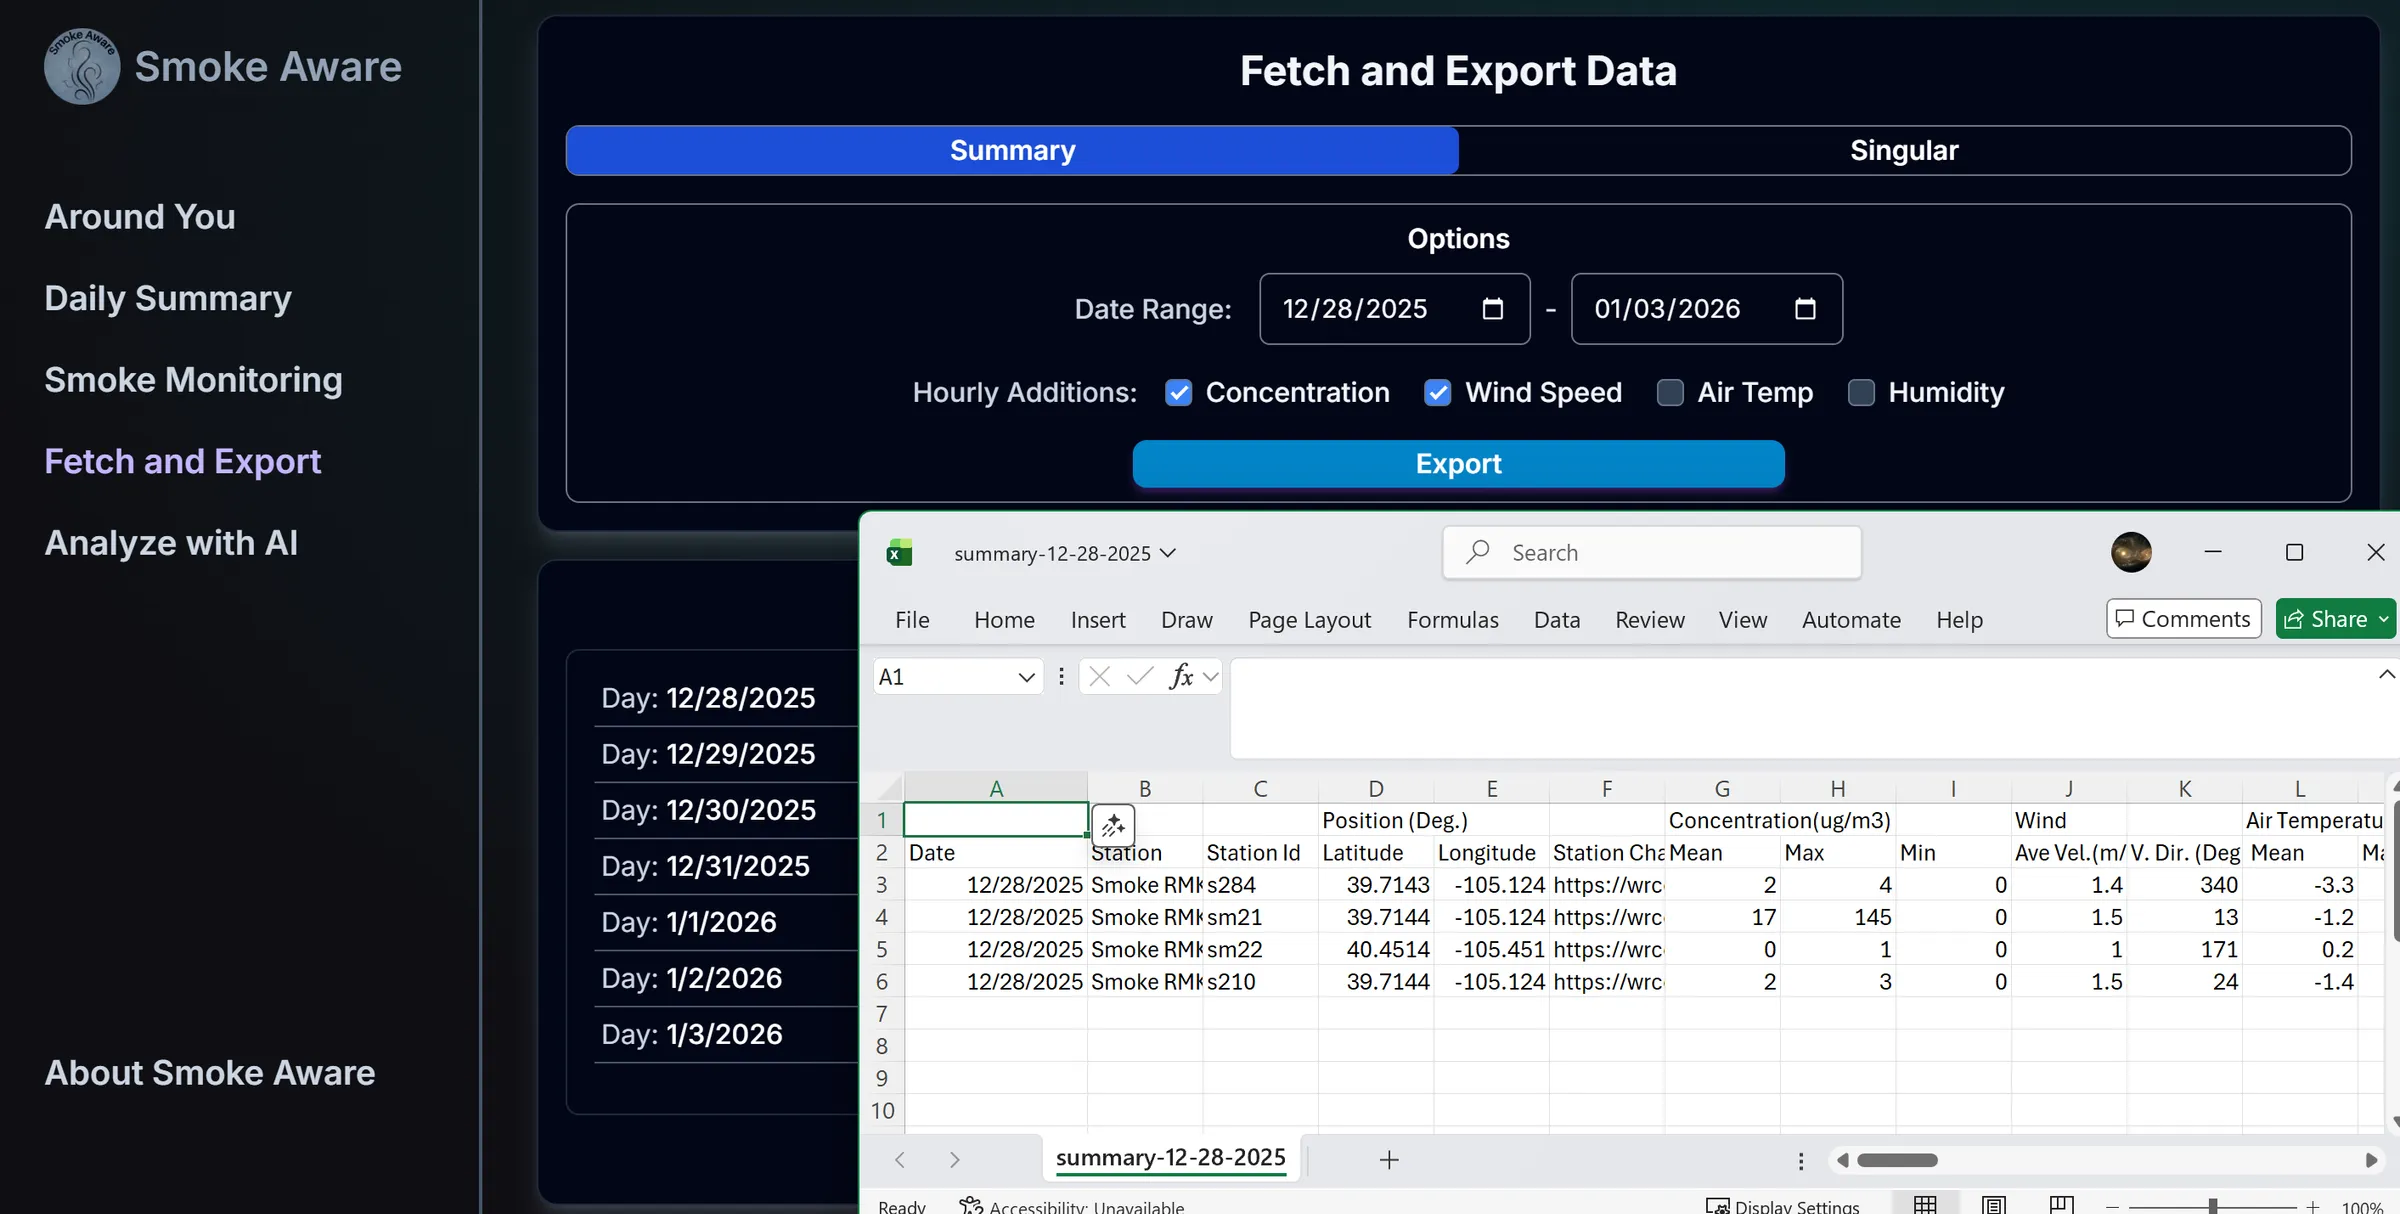
Researchers mostly want the raw numbers. Fetch and Export takes a date range and builds a zip of CSVs, one per day, with a preview before you download.
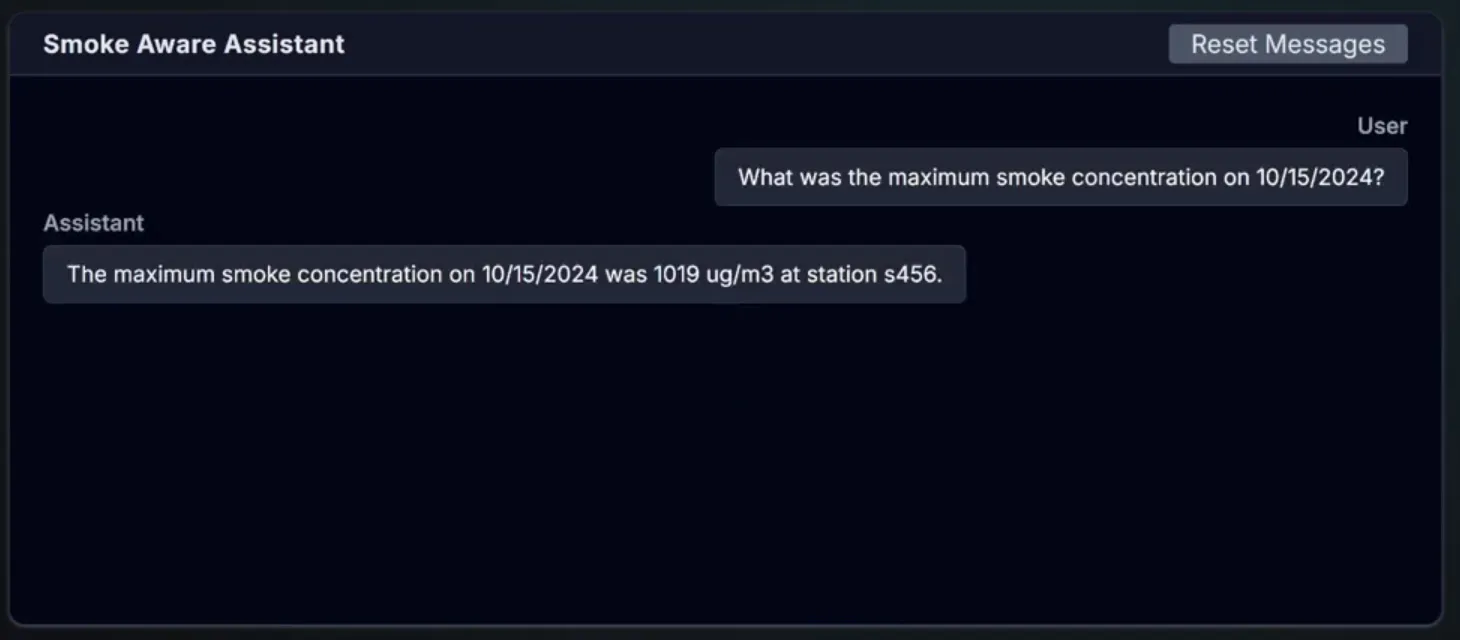
Those exports are also what the assistant reads. Upload a few days of summaries and ask about them. It searches the files and answers from what’s in them.
When I moved from OpenAI’s Assistants API to the newer Responses API, retrieval became optional: it only switches on when a vector store is configured.
What I’d change
The live routes that scrape WRCC are failing right now, and WRCC has started redirecting to an archive domain, which is the likely cause. The scraper needs to follow that, and it should have had a fallback source from the start.